Análisis Hipótesis Nula: Prueba Inicial
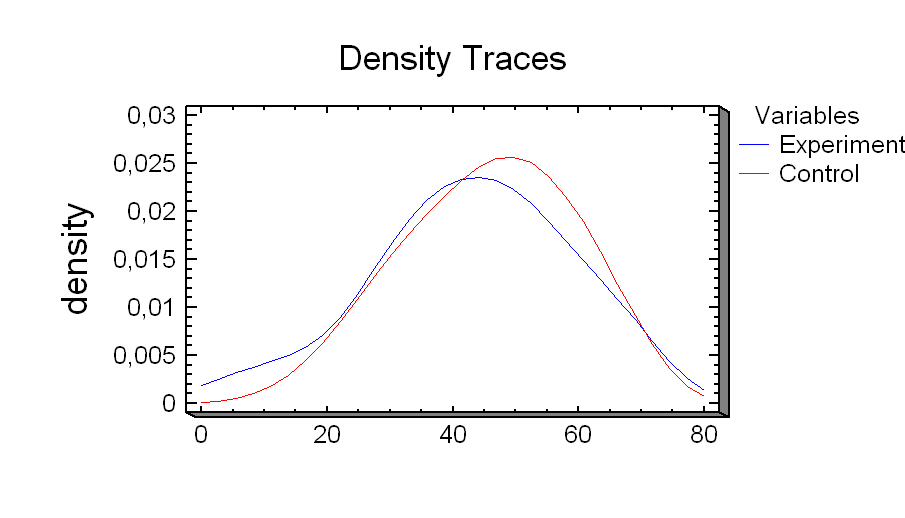 La presente gráfica compara los resultados obtenidos por el grupo experimental (903) y el grupo control (904) en la prueba inicial de comprensión lectora. Utilizamos el software Statgraphics V 5.10 para hacer el respectivo análisis de la hipótesis nula, obteniendo los siguientes resultados:
Hypothesis Tests for Experimental-Control
Sample mean = -2,88948
Sample median = -1,725
t-test
------
Null hypothesis: mean = 0,0
Alternative: not equal
Computed t statistic = -0,827657
P-Value = 0,414863
Do not reject the null hypothesis for alpha = 0,05.
sign test
---------
Null hypothesis: median = 0,0
Alternative: not equal
Number of values below hypothesized median: 18
Number of values above hypothesized median: 11
Large sample test statistic = 1,11417 (continuity correction applied)
P-Value = 0,265204
Do not reject the null hypothesis for alpha = 0,05.
signed rank test
----------------
Null hypothesis: median = 0,0
Alternative: not equal
Average rank of values below hypothesized median: 14,3333
Average rank of values above hypothesized median: 16,0909
Large sample test statistic = 0,865004 (continuity correction applied)
P-Value = 0,387035
Do not reject the null hypothesis for alpha = 0,05.
Lo anterior nos indica que los dos cursos no presentan diferencias estadísticas significativas dentro de un rango de confianza del 95%. Por lo que podemos afirmar que sus niveles de comprensión lectora, iniciales, son muy parecidos, por no decir que idénticos y que la diferencia de sus respectivos promedios se debe a un error de muestreo.
Escrito por Juan F. Remolina Caviedes @ 6:08 p. m.
0 comentarios
![]()

0 Comments:
Publicar un comentario
<< Home